Welcome! On this site you will learn data visualization with Python. You will find code examples of Python graphs made with matplotlib, seaborn, plotly and other packages
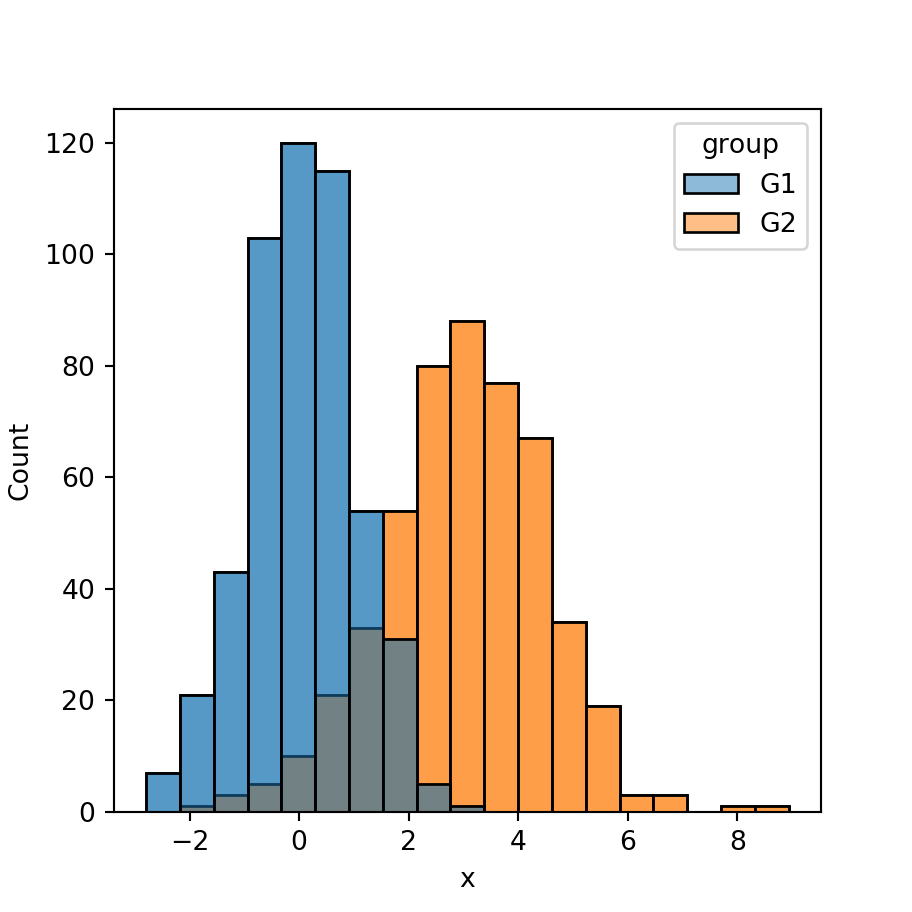
CHART TYPES
Distribution
Distribution charts allow visualizing how the data distributes along the support and comparing several groups
Correlation
Correlation charts are useful for visualizing the relationship between two or more variables
Evolution
Evolution charts show how a variable or a set of variables evolve, generally over space or time
Spatial
These plots show geographical areas and their relations based on one or several variables associated with those areas
Part of a whole
Part of a whole charts summarize the data in portions or slices. These types of charts are very useful for representing counts or groups
Ranking
Ranking charts allow visualizing the classification between the observations of a variable or between different variables